
Spotfire®
Industrial Analytics & Visual Data Science
An advanced visual analytics platform combining interactive data exploration, statistical analysis and AI-assisted capabilities to help organizations understand complex data and support informed decision-making.

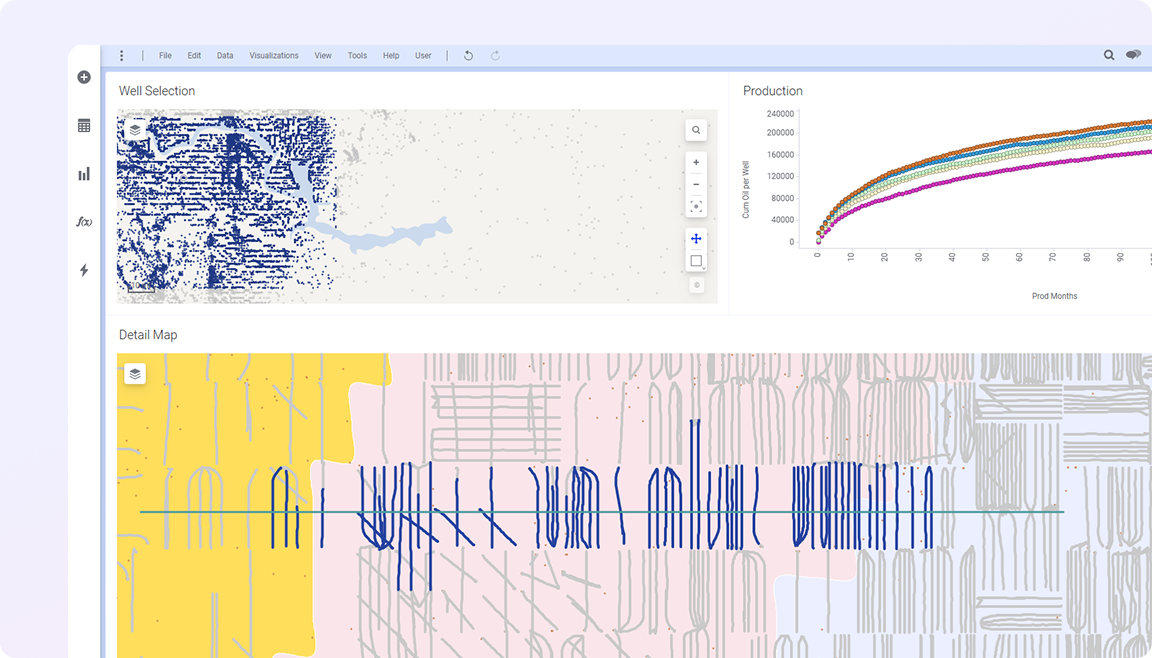
Overview
Spotfire is a visual analytics platform for exploring and analyzing data from many sources in interactive, linked visualizations, with statistical and data science methods available within the same analyses.
Available capabilities depend on the Spotfire edition and license in use.
Key capabilities
- Interactive visual analytics: explore complex datasets using interactive visualizations, filtering and multidimensional analysis.
- Advanced analytics & data science: apply statistical techniques, predictive analytics and machine learning within analytical workflows.
- Industrial data integration: bring together information from multiple enterprise, engineering and operational data sources.
- Geospatial & time-series analytics: analyze spatial patterns, historical trends and time-dependent operational behavior.
- AI-assisted analytics: use supported AI-assisted capabilities to accelerate data exploration and analytical investigation.
- Enterprise analytics: develop and share governed analytical applications and collaborative insights.
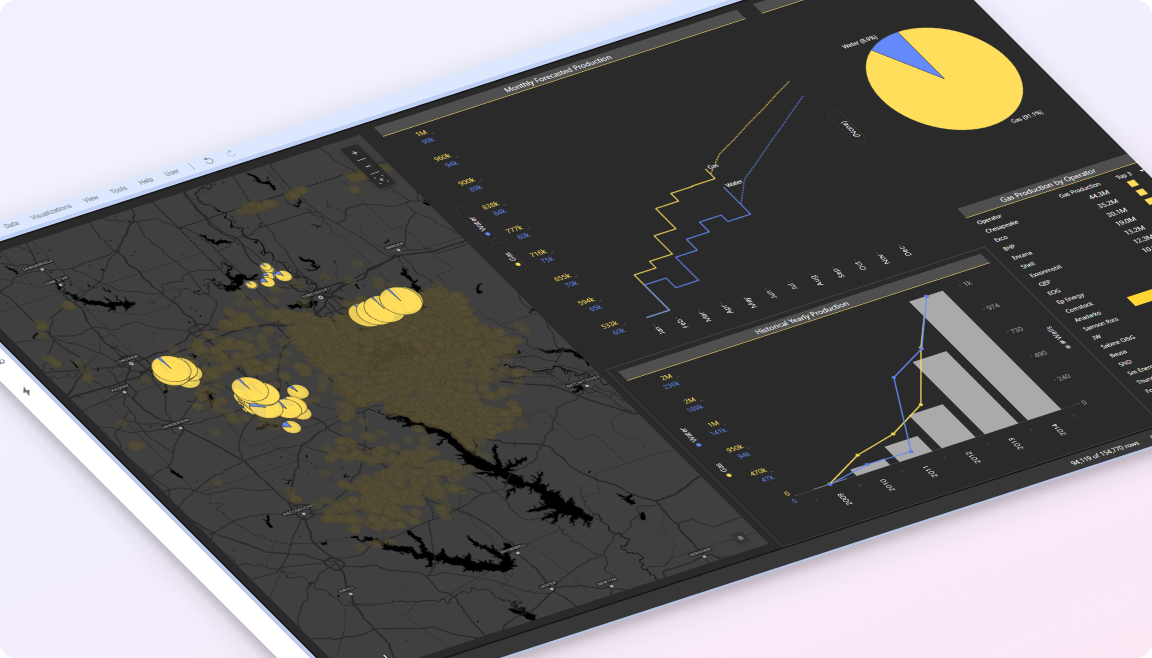
Applications
Exploration and production data analysis.
Subsurface and reservoir data visualization.
Drilling and well performance analytics.
Production monitoring and optimization.
Operational and industrial data analysis.
Cross-domain engineering and business analytics.
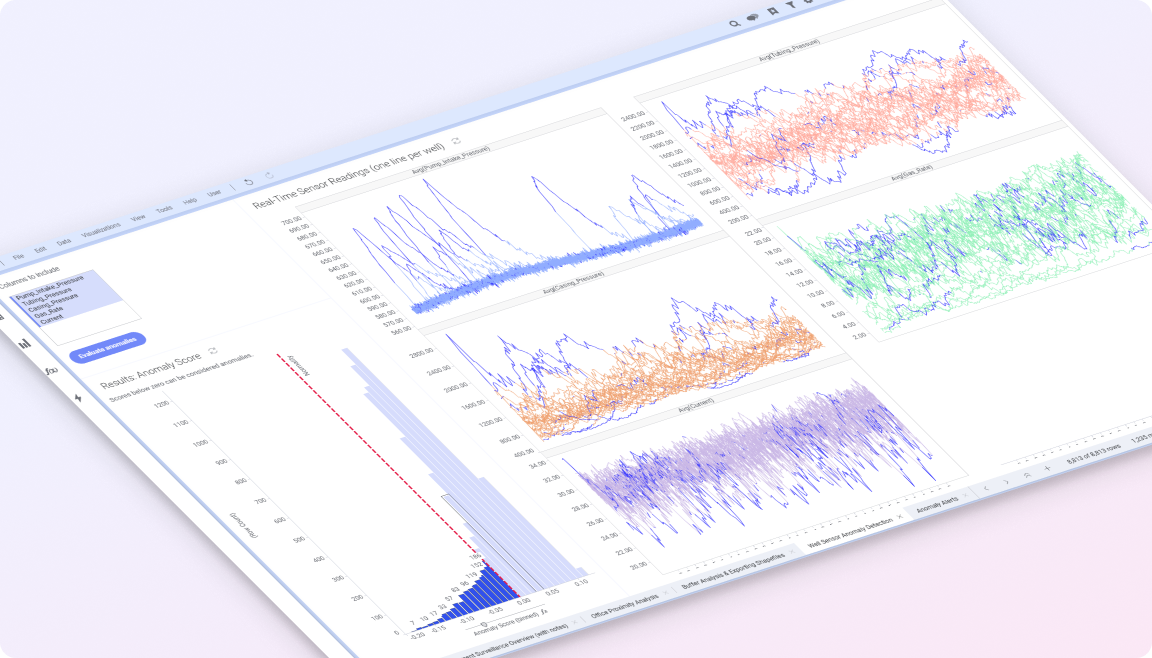
Developer
Spotfire develops the Spotfire® visual analytics platform, used across industries including energy.
Official websiteTechnical resources
Interested in Spotfire®?
Speak with one of our specialists about Spotfire® and your project requirements.