
Maestro™
Advanced Seismic Visualization
Transform seismic data into geological understanding with Maestro™, advanced visualization software developed by Sound QI Solutions. Designed to support geoscientists in exploring seismic information, identifying meaningful geological relationships, and improving interpretation workflows.

Overview
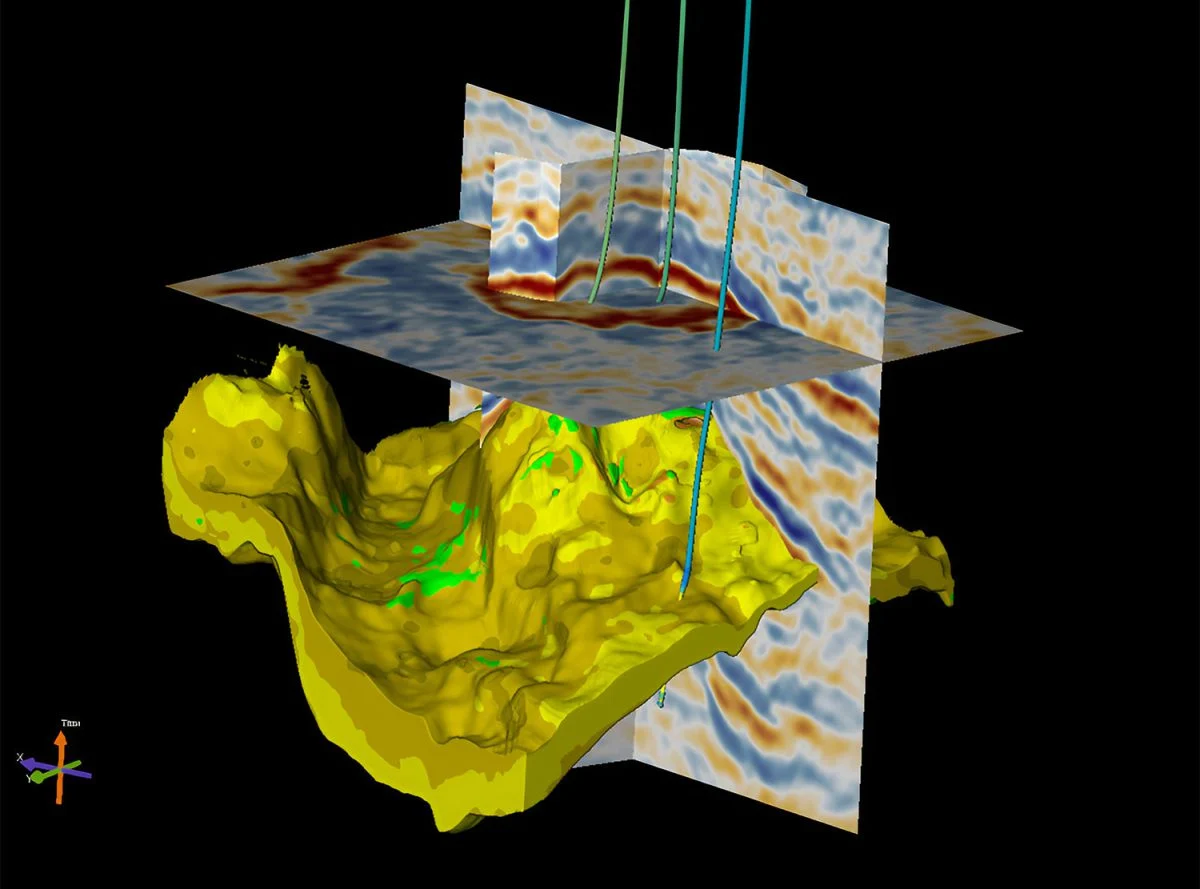
Maestro™ is an advanced visualization platform for multi-attribute data interpretation. It integrates and translates spatial attributes into reservoir properties, combining the available data into logical categorizations, detailed predictions and meaningful interpretations.
It was originally developed to visually integrate and interpret multiple attributes from large seismic datasets, based on Sound QI's quantitative interpretation methodology, and was previously known as QI-Pro. Interpretations are built through visible, user-defined criteria rather than black-box algorithms.
Key capabilities
- Interactive 3D visualization of multiple data layers.
- Interactive crossplot classification, including nested crossplots organized in a hierarchy of attribute criteria.
- Attribute scanning to identify useful relationships between attributes.
- Virtual attributes for on-the-fly computations.
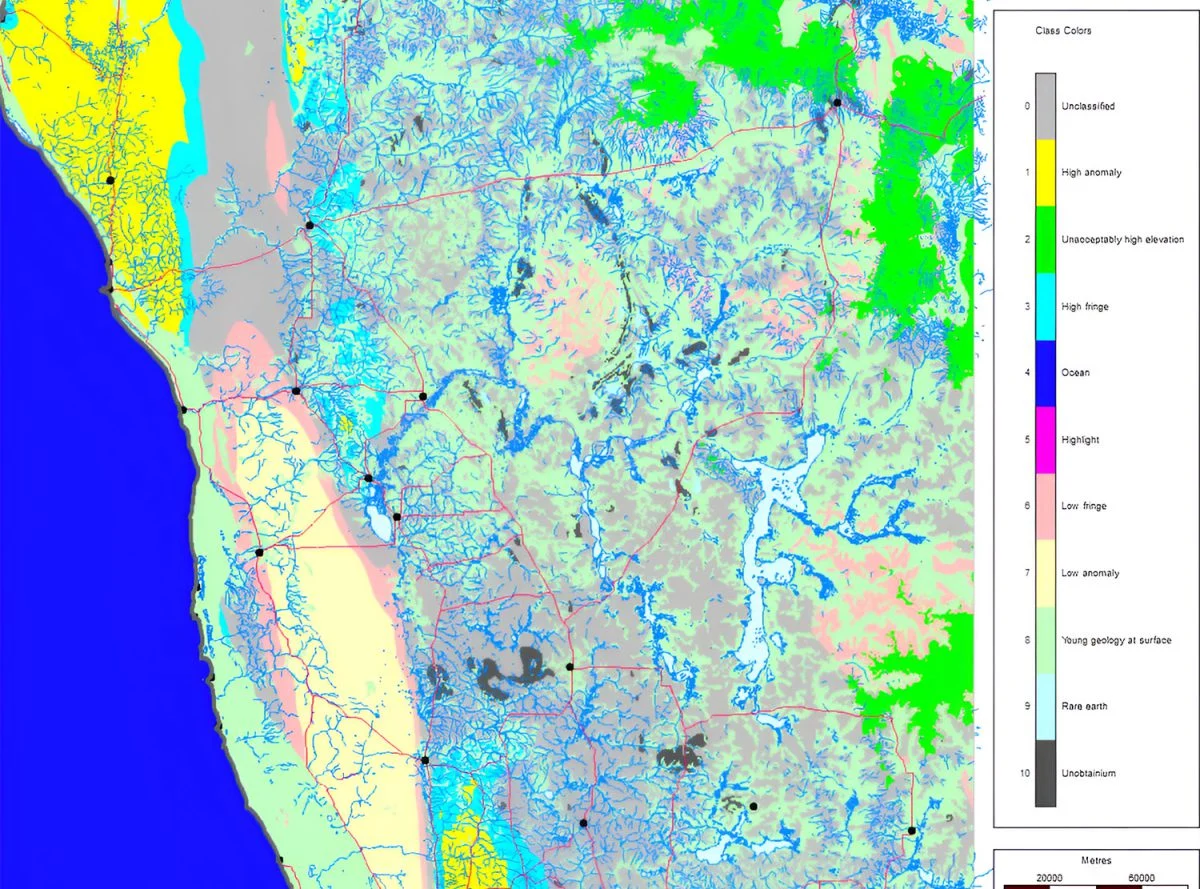
- Multi-attribute map classification of overlain gridded maps.
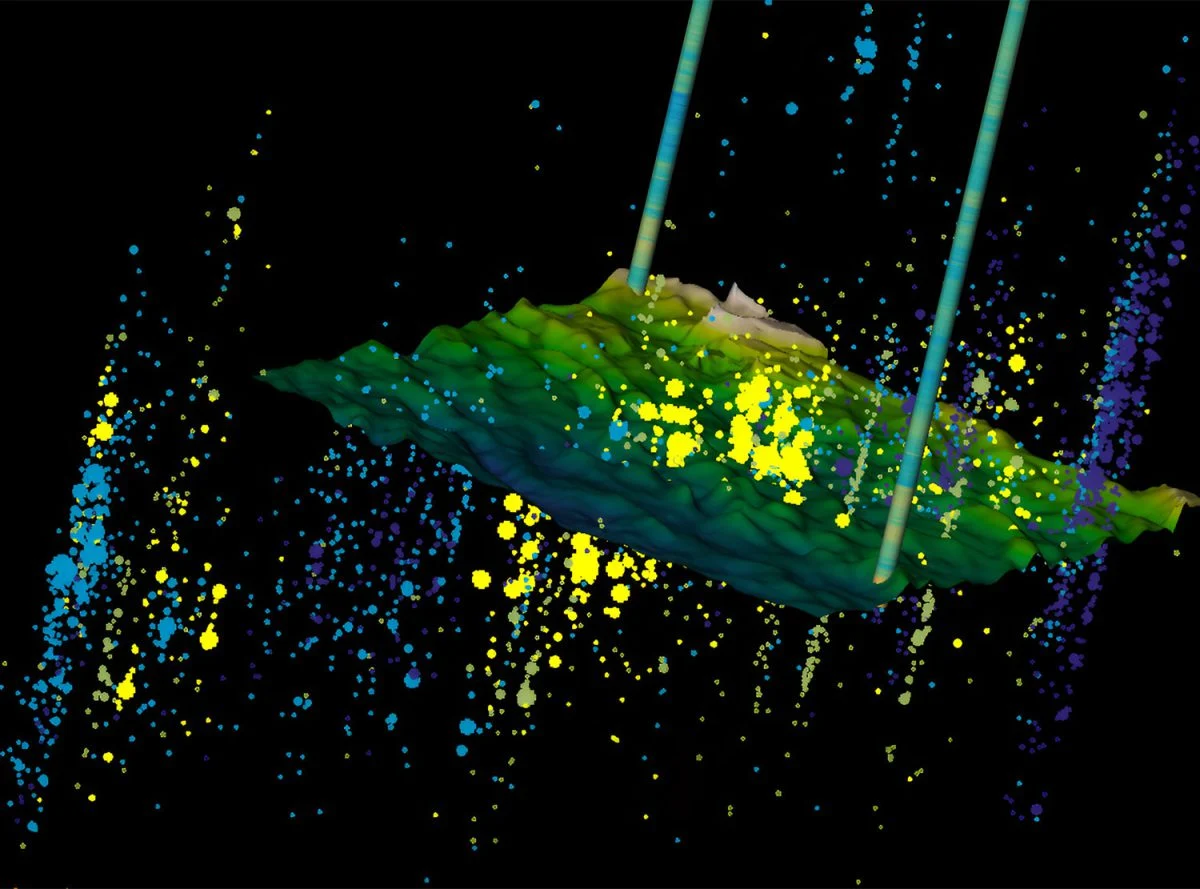
- Spatial point data displayed by colour and size with multi-value classification.
Applications
Seismic attribute interpretation: classify lithology, porosity and fluids from 2D, 3D, 4D, 3C, elastic, spectral and structural attributes.
Well data integration: display logs, borehole measurements, mud logs and core as interactive composite classes.
Reservoir and production analysis: combine reservoir and production data with classified seismic properties.
Drilling and completion analysis: relate operational and geomechanical data, such as frac stages and completion parameters, to classified seismic properties like brittleness and porosity.
Microseismic analysis: classify 3D point data alongside wells and seismic horizons.
Cross-disciplinary interpretation: bring geoscience and engineering data together in one shared view of the reservoir.
Developer
Sound QI Solutions Ltd. provides quantitative seismic interpretation services and develops Maestro™, software for multi-attribute data interpretation.
Official websiteTechnical resources
Interested in Maestro™?
Speak with one of our specialists about Maestro™ and your project requirements.